Weekly Crypto Price Forecast | Bitcoin Eyes $120K Breakout (Nov 10–17, 2025)

The second week of November opens with renewed optimism as Bitcoin (BTC) stabilizes above the $106K zone after defending support for nearly three consecutive weeks. With volatility tightening and momentum indicators showing early signs of strength, analysts see potential for a breakout toward $120K — provided BTC can reclaim key resistance near $111K–$113K.
Market Overview
Bitcoin continues to consolidate after rejecting the $111K resistance last Friday, with prices oscillating near $107K–$108K over the weekend.
On-chain and technical data reflect a fragile equilibrium:
Online advertising service 1lx.online
- RSI (1D): hovering around 48–50, showing neutral momentum.
- MACD: flattening near the zero line with fading histogram amplitude.
- Volume: still below the 30-day average, confirming low participation.
- EMAs (20/50): tightly coiled, signaling indecision and a possible volatility expansion soon.
- Order Blocks: major supply rests near $111K–$113K, while demand sits at $104K–$106K.
Data from Glassnode shows exchange inflows have slightly increased, while CryptoQuant reports a minor rise in miner outflows — both signals of cautious distribution before the next move.
Meanwhile, @rektcapital points to a “mid-range compression identical to the pre-breakout structure of early 2024,” while @CryptoTony_ notes that “Bitcoin is coiling tighter — one decisive candle could determine the next $10K move.”
Bullish Setup: Breakout Toward $118K–$122K
A bullish continuation becomes likely if Bitcoin successfully holds above the $106K–$107K support zone and breaks through $111K resistance on strong volume.
The pattern resembles previous “volatility coil” structures that often precede impulsive rallies.
Why This Could Happen
- ETF inflows stabilize after two weeks of outflows, renewing demand from institutions.
- RSI rises above 55 on the 4-hour chart, indicating growing bullish momentum.
- MACD turns positive, confirming a bullish divergence at the mid-range base.
- Short liquidations above $111K could trigger cascading upside as bears exit positions.
Key Technical Levels
- Support: $106K–$107K
- Resistance: $111K–$113K
- Targets: $116K → $118.5K → $122K
- Indicators: RSI > 60, MACD cross-up, 20-EMA reclaim on 1D chart.
Invalidation: A daily close below $105K cancels the bullish setup and re-opens downside pressure toward $102K.
Online advertising service 1lx.online
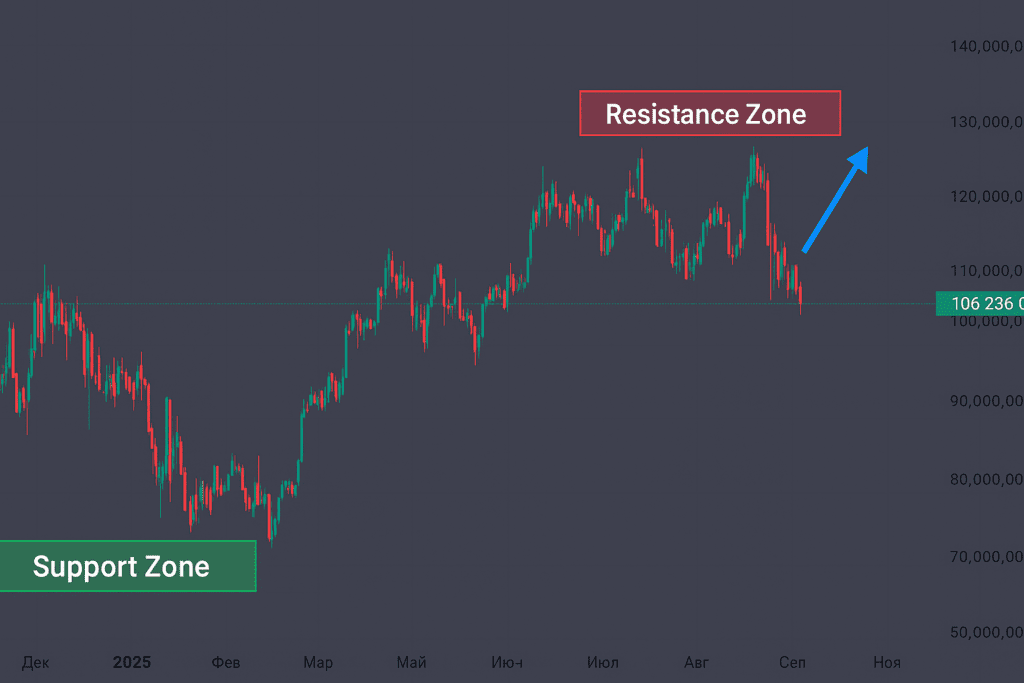
Technical Chart Notes
The BTC/USD chart continues to show a tightening wedge with visible liquidity clusters at $111K–$113K.
Bulls maintain a structural advantage as long as the $106K–$107K support holds — this area corresponds to both the 50-EMA and the prior demand block from early October.
Weekly Outlook
If buyers reclaim $111K with conviction, Bitcoin could enter a short-term momentum phase targeting $118K–$120K. RSI strength and MACD crossover support this thesis, suggesting that the current range may serve as an accumulation base before continuation.
Online advertising service 1lx.online
Traders should monitor ETF flow data and intraday volume spikes for early breakout confirmation.
For daily updates, trend confirmations, and extended forecasts, explore the
Weekly Crypto Price Forecast section on BTCNews.space.
Our creator. Creates amazing NFT collections! Support the editor - Bitcoin_Man(TON) / Bitcoin Man Stickers(TON) / BM Numbers (TON) / Comics Book (TON) / Bitcoin_Man (ETH)
Pi Network (Guide)is a new digital currency developed by Stanford PhDs with over 55 million participants worldwide. To get your Pi, follow this link https://minepi.com/Tsybko and use my username (Tsybko) as the invite code.
Binance: Use this link to sign up and get $100 free and 10% off your first months Binance Futures fees (Terms and Conditions).
Bitget: Use this link Use the Rewards Center and win up to 5027 USDT!(Review)
Bybit: Use this link (all possible discounts on commissions and bonuses up to $30,030 included) If you register through the application, then at the time of registration simply enter in the reference: WB8XZ4 - (manual)