Weekly Bitcoin Bullish Forecast: Momentum Builds Above Key EMAs (Feb 16–22, 2026)

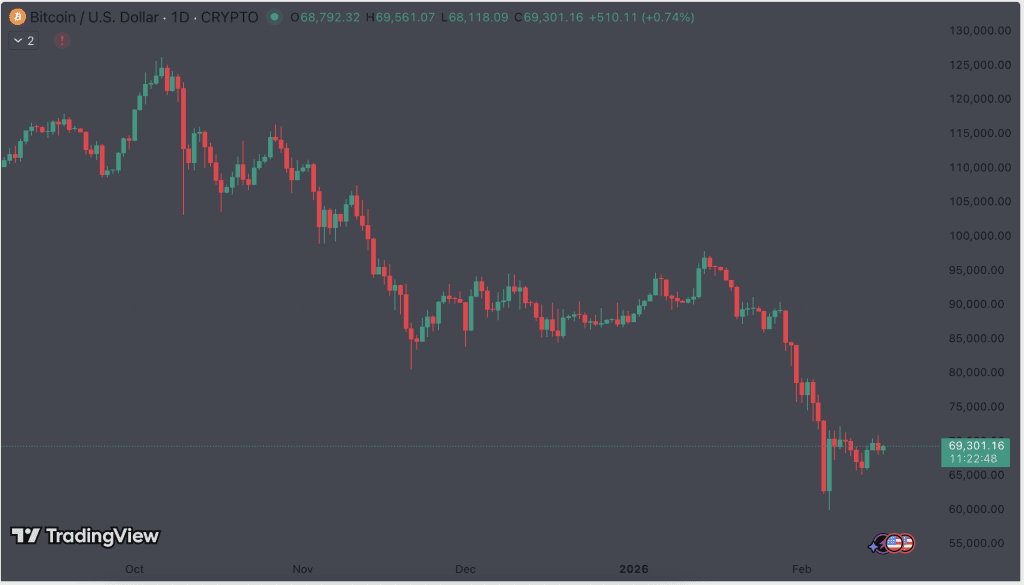
Bitcoin enters February 16–22, 2026 with a cleaner bullish structure than it had earlier this month: buyers defended a higher-low zone, volatility is waking up, and the daily trend alignment is improving. The near-term question is simple — can BTC hold key moving averages long enough to trigger a continuation move into higher liquidity pockets?
Market overview: why this week matters
After a rebound from a clearly defended demand area, Bitcoin has reclaimed short-term trend markers and pushed back into a zone where breakouts often accelerate quickly (because liquidity tends to cluster above recent swing highs). Derivatives positioning looks less “crowded” than during prior impulse moves, which reduces the risk of an immediate long squeeze if price pulls back.
Online advertising service 1lx.online
This setup also fits the broader narrative we’ve been tracking across Bitcoin News: BTC is trading more like a macro asset with periodic volatility expansions, not a constant hype cycle.
Bullish scenario: trend alignment + liquidity magnet
Technical structure and EMAs
The bullish case strengthens when Bitcoin holds above key exponential moving averages (EMAs) on the daily chart. Conceptually, this matters because:
- EMA20 / EMA50 act like “trend health” filters for swing traders and systematic strategies.
- A rising EMA200 often signals longer-horizon trend support is rebuilding.
- When price reclaims an EMA zone and confirms it as support, it can trigger follow-through buying from both discretionary and rules-based participants.
A strong bullish week typically requires two conditions:
- BTC remains supported above its reclaimed EMA cluster, and
- price breaks into (and through) nearby resistance with clear demand, not thin wicks.
Momentum indicators (what to watch, not worship)
- RSI: A push from mid-range toward the upper band can confirm momentum without necessarily screaming “overbought.”
- MACD: A positive shift in histogram momentum often appears during early continuation phases.
- Volume behavior: Rising volume on green candles matters more than single “spike” candles — it suggests participation, not just a one-off liquidation flush.
Online advertising service 1lx.online
If you’re building a visual for this week’s map, a clean way is: Daily chart + EMA20/50/200 + marked demand zone + last swing high liquidity line.
On-chain context: the supply story behind the candles
Even in a technically driven week, the highest-quality “confirmation layer” comes from on-chain and exchange behavior — especially when the market is deciding whether a rally has real backing or is mostly leverage.
Here are the core on-chain signals that can support the bullish scenario:
- Exchange reserves trending lower: fewer coins available on exchanges generally reduces immediate sell pressure.
- Whale accumulation patterns: large-wallet behavior can signal quiet positioning ahead of volatility expansion.
- Long-term holder stability: when longer-term supply remains resilient, corrections often get bought rather than feared.
Online advertising service 1lx.online
This theme connects naturally with older BTCNews coverage such as Bitcoin exchange balances drop again — but this time it’s not retail and Bitcoin whales go quiet after OTC transfers — both useful context pieces when interpreting “quiet” price action.
Key levels and invalidation rules
A bullish forecast must include strict invalidation — otherwise it’s just vibes.
Support zones
- Primary support: $71,500
- Secondary support: $69,800
Resistance targets
- First resistance: $75,200
- Next expansion zones: $78,000 and $82,500
Bullish invalidation
- A daily close below $69,800 shifts the probability away from continuation and toward deeper retest behavior.
If BTC breaks above $75,200 with participation, a common follow-through mechanic is short liquidation fuel (not “price prediction,” just how liquidity behaves when stops sit above prior highs).
Institutional and cross-market lens
Bitcoin’s weekly structure doesn’t exist in isolation. When risk appetite returns, capital often rotates across majors — and Ethereum frequently acts as a secondary confirmation signal.
For cross-market context, watch whether ETH is stable or strengthening during BTC’s breakout attempts, and follow developments in Ethereum News when the market narrative shifts from “BTC-only” to broader risk-on behavior.
Outlook: bullish continuation, if support holds
This week’s bullish scenario remains intact as long as BTC holds the reclaimed support band and continues to compress volatility into a breakout structure. If the breakout triggers, the most likely path is a liquidity-driven push toward upper targets, followed by either:
- a controlled consolidation above reclaimed levels, or
- a fast spike-and-retest that decides whether the move is structural or purely leverage.
For more market maps like this, explore our Weekly Crypto Price Forecast section.
Our creator. Creates amazing NFT collections! Support the editor - Bitcoin_Man(TON) / Bitcoin Man Stickers(TON) / BM Numbers (TON) / Comics Book (TON) / Bitcoin_Man (ETH)
Pi Network (Guide)is a new digital currency developed by Stanford PhDs with over 55 million participants worldwide. To get your Pi, follow this link https://minepi.com/Tsybko and use my username (Tsybko) as the invite code.
Binance: Use this link to sign up and get $100 free and 10% off your first months Binance Futures fees (Terms and Conditions).
Bitget: Use this link Use the Rewards Center and win up to 5027 USDT!(Review)
Bybit: Use this link (all possible discounts on commissions and bonuses up to $30,030 included) If you register through the application, then at the time of registration simply enter in the reference: WB8XZ4 - (manual)