Weekly Bitcoin Bearish Forecast: Breakdown Risk Below Structural Support (Feb 16–22, 2026)

Bitcoin long-term structure may remain constructive, but the week of February 16–22, 2026 carries short-term downside risk if critical support zones fail. Momentum indicators are softening, sell-side liquidity is quietly rising, and derivatives positioning suggests the market could be vulnerable to a volatility expansion lower.
This Bitcoin bearish forecast outlines the conditions under which BTC could shift from consolidation into corrective pressure.
Market overview: pressure building under resistance
Online advertising service 1lx.online
Bitcoin is currently pressing against short-term support while overhead liquidity remains thick near recent highs. Price is not collapsing — but it is struggling to reclaim prior breakout zones, a subtle warning sign in trending markets.
This fits into a broader pattern observed across recent Bitcoin News coverage: when BTC hesitates under resistance while open interest remains elevated, the risk of forced liquidations increases.
You can see more updates and structural analysis in our dedicated Bitcoin News section.
Macro sentiment also matters this week. Equity volatility has ticked higher, and mild risk-off behavior across traditional markets can spill into crypto flows. When correlation tightens, Bitcoin often reacts faster than stocks — not slower.
Bearish scenario analysis: what would confirm weakness?
Technical signals flashing caution
A bearish week does not require panic. It requires structure failure.
Key warning signals include:
- Price slipping below EMA20, threatening EMA50 support.
- A developing MACD bearish crossover on the daily timeframe.
- RSI drifting toward 40, indicating weakening bullish momentum.
- Rising volume on red candles, confirming distribution rather than passive pullback.
- A breakdown below a previously respected order block.
Online advertising service 1lx.online
In this Bitcoin bearish forecast, the most important trigger is loss of the higher-low structure that bulls have defended in recent weeks.
Liquidity mechanics: why support breaks can accelerate
When price compresses above support with high open interest, the downside risk increases because:
- Leveraged longs cluster stops below support.
- A single strong push can cascade into liquidation-driven volatility.
- Thin order book zones below support often act as fast-travel areas.
We’ve seen similar structural stress in previous BTCNews analysis, including Bitcoin miner selling pressure is rising — and it’s not coming from traders and Bitcoin miners are selling again — but this time the pressure is structural — both highlighting how supply-side stress can quietly build before visible price reactions.
Online advertising service 1lx.online
On-chain warning signals: subtle but important
Primary dashboards such as Glassnode and CryptoQuant often reveal shifts before charts fully reflect them.
Bearish on-chain cues include:
- Rising exchange inflows, suggesting growing sell-side liquidity.
- Miner outflows ticking higher, often preceding short-term distribution phases.
- Whale wallets showing partial distribution rather than accumulation.
None of these alone guarantee downside — but together they form the foundation of a credible Bitcoin bearish forecast.
If exchange balances rise sharply while price tests support, the probability of breakdown increases materially.
Downside levels to monitor
A bearish scenario must include specific structural levels:
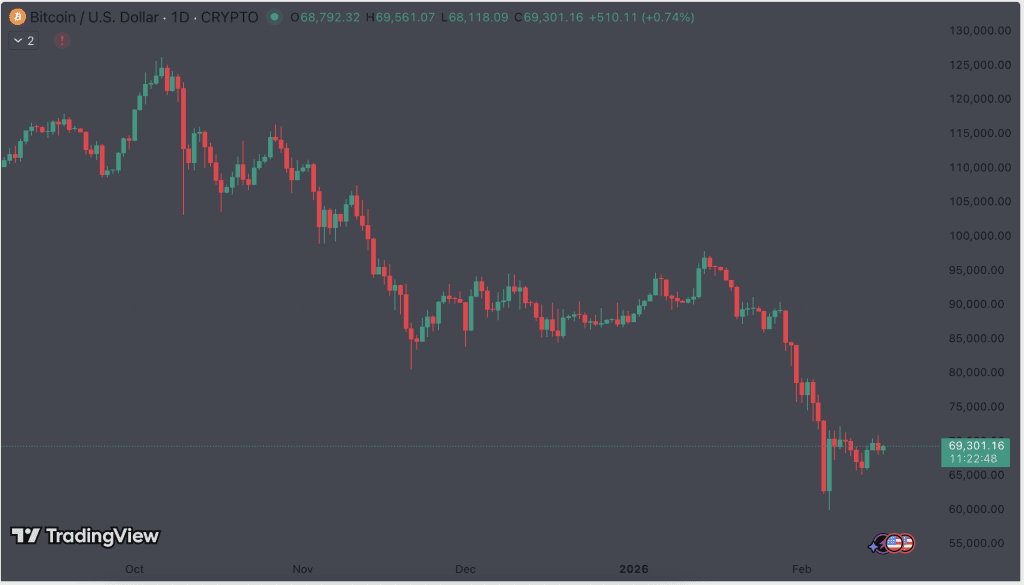
Primary support
- $69,500
Secondary support
- $66,800
Extended liquidity target
- $62,000
Bearish invalidation
- Strong daily close above $75,500
A confirmed breakdown below $69,500 could quickly expose deeper liquidity pools as leveraged longs unwind.
Technical setup: EMA failure risk
Failure to hold EMA50 increases the probability of a deeper retracement toward EMA200. In trending markets, EMA50 acts as dynamic support; losing it often signals trend fatigue.
If downside volatility expands with increasing volume, short-term structure shifts bearish even if long-term fundamentals remain intact.
For cross-market context, monitor whether Ethereum stabilizes or weakens during BTC’s test of support. Rotation patterns and broader crypto sentiment can be tracked in Ethereum News when BTC structure falters.
Outlook for the week: corrective, not catastrophic
A bearish week does not automatically mean a macro trend reversal. It can represent:
- A liquidity reset.
- A leveraged position flush.
- A retest of long-term demand zones.
However, in this Bitcoin bearish forecast, traders should respect the structure: if higher-lows fail, volatility can expand rapidly before buyers step in.
Summary
Short-term momentum is weakening, exchange inflows are rising modestly, and pressure on key EMAs is increasing. While not guaranteed, the probability of a corrective move rises if support breaks decisively.
For broader scenario-based analysis, explore our Weekly Crypto Price Forecast archive.
Our creator. Creates amazing NFT collections! Support the editor - Bitcoin_Man(TON) / Bitcoin Man Stickers(TON) / BM Numbers (TON) / Comics Book (TON) / Bitcoin_Man (ETH)
Pi Network (Guide)is a new digital currency developed by Stanford PhDs with over 55 million participants worldwide. To get your Pi, follow this link https://minepi.com/Tsybko and use my username (Tsybko) as the invite code.
Binance: Use this link to sign up and get $100 free and 10% off your first months Binance Futures fees (Terms and Conditions).
Bitget: Use this link Use the Rewards Center and win up to 5027 USDT!(Review)
Bybit: Use this link (all possible discounts on commissions and bonuses up to $30,030 included) If you register through the application, then at the time of registration simply enter in the reference: WB8XZ4 - (manual)