Bitcoin Bullish Forecast: $75K Bounce Sets Up a Relief Rally (Feb 2–8, 2026)

Bitcoin opened the week with a violent sell-off, then snapped back hard from the $75,000 zone — the kind of wick that often marks short-term seller exhaustion. This Bitcoin bullish forecast February 2026 focuses on whether that rebound can turn into a structured relief rally toward key resistance.
After the flush, the market is no longer trading “direction” — it’s trading liquidity. The question for this week is simple: did $75K attract real buyers, or just short-covering that fades the moment BTC hits overhead supply?
You can see more updates and market stories in our dedicated Bitcoin News section, where we track the same “capitulation → rebound → decision” pattern across different market cycles.
Online advertising service 1lx.online
Market Overview: Capitulation Wick, Then Immediate Absorption
The $75,000–$76,000 area acted like a high-interest demand zone, with aggressive absorption visible in the rebound structure. In many past cycles, that kind of “liquidity sweep” sets the stage for a tactical rebound — not necessarily a full trend reversal, but a tradable move as leverage resets and spot demand steps in.
This week’s Bitcoin bullish forecast February 2026 is built around one core assumption: the market has already printed its “panic low” for the week, and now needs to prove strength by reclaiming structure above key moving averages.
For broader weekly coverage and scenarios, follow the Weekly Crypto Price Forecast hub.
Bullish Scenario Thesis: A Relief Rally, Not a New Bull Market
What confirms the bullish case
The bullish scenario becomes active if BTC holds above $75K and starts building higher lows on intraday timeframes. The rebound can extend if the market transitions from “reaction” to “acceptance” — meaning price starts to hold above reclaimed levels, not just spike into them.
Bullish drivers to watch
- RSI behavior: a rebound from deeply oversold conditions can support a multi-day bounce, especially if RSI stabilizes above the midline on lower timeframes.
- MACD momentum shift: still negative after the dump, but a slowing sell impulse often precedes relief rallies.
- EMA reclaim: the first meaningful technical checkpoint is recovering EMA20 and holding above it.
- Liquidation mechanics: sharp wicks often represent forced selling; once that pressure clears, price can travel quickly to the next liquidity pool.
Online advertising service 1lx.online
A useful structural context: if miners and larger entities are under pressure, rebounds can still happen — but they tend to be fast, tactical, and resistance-sensitive. That’s why this Bitcoin bullish forecast February 2026 stays focused on levels, not emotions.
Key Levels for Feb 2–8, 2026
Support (must hold)
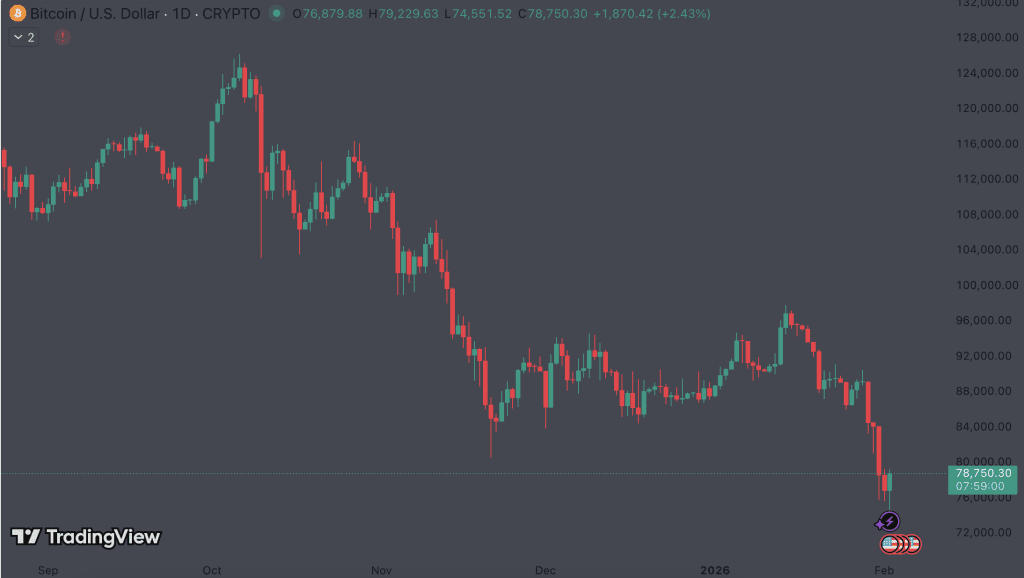
- $75,000–$76,000 (weekly “line in the sand”)
- Secondary pivot: $78,000 (needs to flip into support)
Online advertising service 1lx.online
Resistance (targets)
- $82,000 (first major supply zone)
- $85,500 (trend decision area)
- Stretch target: $88,000 (if momentum and volume expand)
Invalidation
- A daily close below $74,500 weakens the bullish thesis and increases odds of a deeper continuation move.
What Could Fuel the Upside: Short Covering + Tactical Accumulation
Relief rallies typically come from a blend of:
- shorts closing after the flush, and
- spot buyers stepping in once volatility resets.
If volume increases on pushes through $82K and BTC holds reclaimed levels (instead of instantly rejecting), it suggests the bounce is evolving into a structured recovery, not a one-day reaction.
For cross-market context, watch whether risk appetite returns to majors like Ethereum too — the broader tone can be tracked via Ethereum News as liquidity often rotates between BTC and ETH during rebound weeks.
Historical Context: BTCNews.space Has Seen This Setup Before
Two recent BTCNews.space pieces connect directly to why this rebound matters now:
- Bitcoin exchange balances drop again — but this time it’s not retail
- Bitcoin miners are selling again — but this time the pressure is structural
Those themes matter because a bounce can be real even during structural selling — it just behaves differently: sharper upside bursts, more violent pullbacks, and heavier resistance reactions.
Outlook for the Week: How the Bullish Path Typically Plays Out
If this bullish scenario holds, the week often unfolds in phases:
- Stabilize above $78K (prove the rebound isn’t fading)
- Test $82K (first serious seller zone)
- Either break to $85.5K (momentum expands)
or reject and range (the bounce becomes consolidation)
Net: this is a relief rally thesis, not a declaration of a new bull trend. The market still needs time to rebuild confidence after a capitulation-style move.
Our creator. Creates amazing NFT collections! Support the editor - Bitcoin_Man(TON) / Bitcoin Man Stickers(TON) / BM Numbers (TON) / Comics Book (TON) / Bitcoin_Man (ETH)
Pi Network (Guide)is a new digital currency developed by Stanford PhDs with over 55 million participants worldwide. To get your Pi, follow this link https://minepi.com/Tsybko and use my username (Tsybko) as the invite code.
Binance: Use this link to sign up and get $100 free and 10% off your first months Binance Futures fees (Terms and Conditions).
Bitget: Use this link Use the Rewards Center and win up to 5027 USDT!(Review)
Bybit: Use this link (all possible discounts on commissions and bonuses up to $30,030 included) If you register through the application, then at the time of registration simply enter in the reference: WB8XZ4 - (manual)